New revelations from Superstorm Sandy data

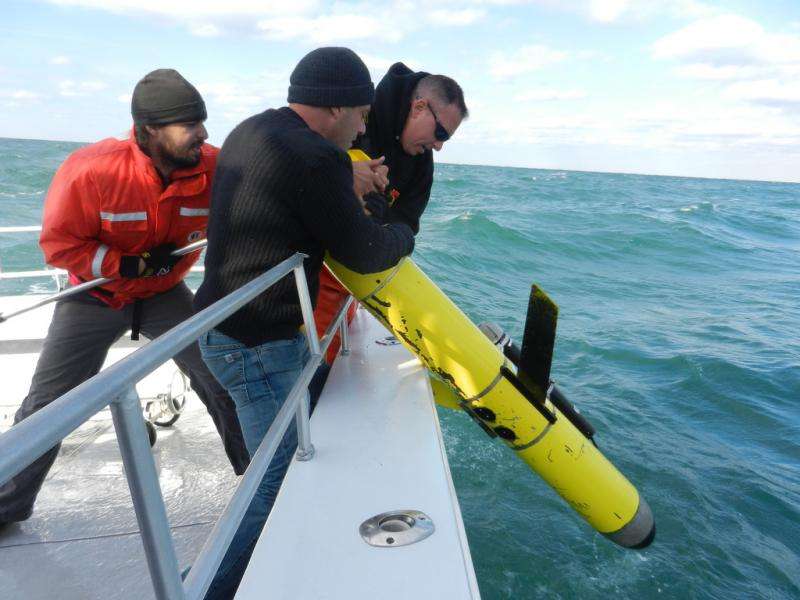
Five years ago next month, four days before Superstorm Sandy made landfall in New Jersey, Rutgers University-New Brunswick marine scientists launched a data-collecting, submersible robot glider in front of the massive storm.
Their paper on the data gathered by that swimming robot – published recently in the Journal of Geophysical Research: Oceans – explains the peculiar ocean systems that helped make Sandy so destructive. Their data has also contributed to models now being used to forecast the intensity, size and track of such storms. The authors are Travis Miles, Greg Seroka and Scott Glenn.
"There's a cold water mass, called the Cold Pool, at the bottom of the Mid-Atlantic Bight (the coastal ocean from Cape Cod to Cape May)," said Travis Miles, now an assistant research professor at Rutgers-New Brunswick's Department of Marine and Coastal Sciences. "Sandy, as it turned left across the continental shelf, pushed that cold water out to sea as much as 70 kilometers, which meant that the water it passed remained warm, which prevented the storm from weakening as it came ashore."
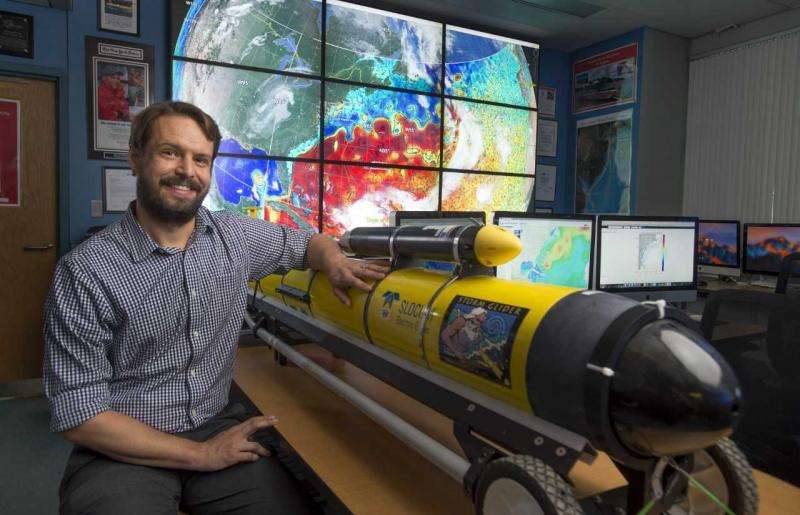
The robot glider they used was one of a fleet that the Rutgers University Center for Ocean Observing Leadership (RU COOL) is deploying in oceans across the globe, along with other new technologies such as high-frequency radar, that have helped change the field of oceanography and the way scientists understand weather, marine life, and related areas.

The Rutgers robot gliders – about 6 feet long, bright yellow and resembling jet airplanes – carry sensors measuring conductivity, temperature and depth. For their Sandy deployment, Miles and co-author Greg Seroka added a velocity sensor outside the hull, to measure the speed of the water through which the robot passed. That sensor provided the data on the effects of Sandy's winds on the Cold Pool.
Seroka is now a staff scientist with the National Oceanic and Atmospheric Administration. He and Miles were graduate students on October 25, 2012, the day they launched their robot glider in front of Sandy. The study's other co-author, Scott Glenn is Distinguished Professor of marine and coastal sciences in Rutgers-New Brunswick's School of Environmental and Biological Sciences, and co-director of RU COOL.
Though the science generated by that glider's collected data was rigorous, the deployment itself was a bit spur-of-the-moment, Miles recalls. The group wasn't certain their glider would survive the storm, or that they'd be able to recover it if it did. When the storm was over, they had trouble finding an available boat and functioning dock from which to recover the device. But given the data's usefulness in helping to forecast storms and potentially save lives, the effort was a clear success.
Miles and Glenn are now working on creating a network of "sentinel" gliders to cruise continuously off the Atlantic coast, helping to provide data for the models used to forecast hurricanes.
Provided by Rutgers University


